Showing posts with label os/x. Show all posts

Monday, February 3, 2014

Python tip[8]

Tip #8

Always use a good bit of data to test your data driven apps. Don't rely only on nose testing. But where to get data? Fake it. Never underestimate the power of import random. But when you need more than numbers:

pip install fake-factory

You can also take a look at faker, faker.py, ForgeryPy (and many more on pypi.python.org). Then there is fake-data-generator. Or if you want a csv or sql, try mockaroo.com

What it does: Although you could use real data, sometimes you don't have any. In fact, more than likely you probably wont be  able to generate a significant amount of data for weeks after going live with your web application. Or perhaps it is a desktop application and you'll never see the generated data. So just fake it. You need volume, and it's easy to create.

Another point to keep in mind is that using real data might be risky, depending on what it is. For sure you do not want real credit card numbers floating around on development instances.


François
@f_dion

Sunday, January 26, 2014

Python tip[7]

Tip #7

Today's tip is quite basic, but will require time and effort to master:

Master the shell environment

What it does: Mac, Windows, Linux, BSD or Unix (or even something else). Whatever your operating system, become really good at using the command line, the shell. Bash, Powershell, ksh93 etc. Learn it. Else, it's like learning a bunch of words in a new language, but never learning the correct constructs. You might be able to communicate, but it'll never be very efficient. So go and find tutorials.

And then find the tools that'll make your life easier.

For example, *nix users, are you familiar with autojump (plus it's written in python)?

Windows users, did you know there is an equivalent Jump-Location for powershell?


François
@f_dion

Monday, January 20, 2014

Python tip[6]

Tip #6

Today's tip is in response to a great question on a local Linux user group:

python -m cProfile myscript.py

What it does: It'll give you a breakdown per line of how much time each operation takes to execute. Normally, profiling is best done with something like dtrace, to minimize the impact on the run time, but the original question was about figuring out the time for each operation in a python script running on the Raspberry Pi (no dtrace...).

Assuming the following script (we'll use sleep to simulate different runtime, and not call the same function either, else each would be collased under one line on the report):
from time import sleep

def x():
    sleep(4)

def y():
    sleep(5)

def z():
    sleep(2)

x()
y()
z()
print("outta here")
we get:
python -m cProfile script.py
outta here
         8 function calls in 11.009 seconds

   Ordered by: standard name

   ncalls  tottime  percall  cumtime  percall filename:lineno(function)
        1    0.000    0.000   11.009   11.009 t.py:1(<module>)
        1    0.000    0.000    4.002    4.002 t.py:3(x)
        1    0.000    0.000    5.005    5.005 t.py:6(y)
        1    0.000    0.000    2.002    2.002 t.py:9(z)
        1    0.000    0.000    0.000    0.000 {method 'disable' of '_lsprof.Profiler' objects}
        3   11.009    3.670   11.009    3.670 {time.sleep}


François
@f_dion

Tuesday, January 14, 2014

Python tip[5]

Tip #5


Meet the triumvirate  of python interactive sessions:

help(), dir(), see()

So no doubt you use help, and probably dir, but you are probably wondering about see()... That's because it has to be installed first:

pip install see

What it does: Unless you speak native dunder (double underscore), dir's output can be a little overwhelming. For example, a dir on an int object (everything is an object in python...) gives us:

>>> dir(1)
['__abs__', '__add__', '__and__', '__class__', '__cmp__', '__coerce__', '__delattr__', '__div__', '__divmod__', '__doc__', '__float__', '__floordiv__', '__format__', '__getattribute__', '__getnewargs__', '__hash__', '__hex__', '__index__', '__init__', '__int__', '__invert__', '__long__', '__lshift__', '__mod__', '__mul__', '__neg__', '__new__', '__nonzero__', '__oct__', '__or__', '__pos__', '__pow__', '__radd__', '__rand__', '__rdiv__', '__rdivmod__', '__reduce__', '__reduce_ex__', '__repr__', '__rfloordiv__', '__rlshift__', '__rmod__', '__rmul__', '__ror__', '__rpow__', '__rrshift__', '__rshift__', '__rsub__', '__rtruediv__', '__rxor__', '__setattr__', '__sizeof__', '__str__', '__sub__', '__subclasshook__', '__truediv__', '__trunc__', '__xor__', 'conjugate', 'denominator', 'imag', 'numerator', 'real']


>>> from see import see
>>> see(1)
    +           -           *           /           //          %           **
    <<          >>          &           ^           |           +obj
    -obj        ~           <           <=          ==          !=          >
    >=          abs()       bool()      divmod()    float()     hash()
    help()      hex()       int()       long()      oct()       repr()
    str()       .conjugate()            .denominator            .imag
    .numerator  .real


A little more human readable, no? Oh, I'm about to hear the complaint about typing from see import see everytime you start up python. Time to go and check tip #2...


François
@f_dion

Friday, January 10, 2014

Python tip[4]

Tip #4


I was mentioning cppcheck on twitter, for those of us who also code in C/C++. I must admit I didn't start using it until I saw Alan (Coopersmith) using it on Xorg about a year ago. So, what do we have for python? Today I'll make a quick mention of Pylint. Install is simple, along the line of (adjust to your package manager):

sudo apt-get install pylint

Then you can go into a python project and do:

pylint your_filename.py

What it does: "Pylint is a tool that checks for errors in Python code, tries to enforce a coding standard and looks for bad code smells", according to pylint.org. It also gives your code an overall mark. It's a good idea to at least run it and look at the suggestions it offers.

Bonus: pylint includes pyreverse which allows one to generate a package and class diagram (UML) from source code. This works ok as long as the code is straight forward.


François
@f_dion

Tuesday, January 7, 2014

Python tip[3]

Tip #3

As you install new modules (say, with pip install) to support your Python application, add them to a requirements.txt file and do the same for your tests, as test_requirements.txt. Installation is then a simple:

pip install -r requirements.txt

What it does: It allows you to keep track of what packages are needed if you share your code, deploy it to other machines, or if you somehow have to rebuild your computer. You can also quickly test that the list is up to date by creating a virtualenv --no-site-packages, and then using a pip for that virtual environment to do the install.


François
@f_dion

Wednesday, January 1, 2014

Python tip[2]

Tip #2

In your home directory, in a file named .env.py put the imports you want to always have preloaded in python interactive mode:
from some_module import something
In your .bashrc or .profile, add:
export PYTHONSTARTUP=$HOME/.env.py
What it does: When you login and open a terminal, the environment variable PYTHONSTARTUP will be set, and when you execute python (or bpython, too), the python interpreter will load whatever scripts are in PYTHONSTARTUP and be ready for you to use them without having to type them everytime. In this example, I could use functionality something of some_module right away.


François
@f_dion

Tuesday, December 31, 2013

Python Tip of the [day, week, month]

PTOTD

Starting tomorrow, I'll post a Python tip on a regular basis. I cant promise a PTOTD, but it'll be more often than once a month, so that identifies the boundaries.

Ok, I lied, I'll start with one right now:

Tip #1

python -i script.py
What it does: At the conclusion of the execution of script.py, instead of exiting, the python interpreter stays in interactive mode, with everything ready to be printed or debugged.

François
@f_dion

Friday, June 14, 2013

dtrace: Python instrumentation

...where time becomes a loop

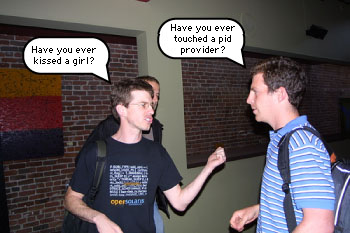
Last year, I mentionned that it was time for the Python community to embrace dtrace. I've gotten questions left and right, at user groups, through email etc as to what is dtrace and how it ties in with Python.


This week, a few posts on the Argentinian and Venezuelan Python lists on debugging Python and a total absence of a mention of dtrace and I knew I had to do a writeup. But before we get into the details, let's step back a bit.

Party like it's 1999 2004

Back in the 1990s I was using Povray (there is a Python API) to do photo quality rendering of made to order products. Eventually, I had to switch to OpenGL, C++, Sun Studio and hardware acceleration in order to keep up with the demand (over 20,000 during normal business hours and there are less than 30,000 seconds during that period of time). A few years later, at peak hours I was serving on the web over 100 renders per second.

Even if I had switched to OpenGL on that particular system, I continued working with Povray in other areas, particularly to design optical systems and build stuff that required visual quality over quantity. While Povray under Windows was fast enough, it felt much slower under Solaris and Linux (whereas my own code ran much faster on Solaris than Windows).


dtrace: First Contact


I posted the following to the solaris-x86 Yahoo group in November of 2004:

I finally ran Povray 3.5 benchmark 1.02 on the exact same hardware and here are the results:

Hardware:
Dell GX260
Pentium 4 2.4GHz
512MB ram
Hitachi 40 GB 7200 rpm
ATI Radeo 7500


Under Windows 2000 SP4, official Povray 3.5 win32 release:
Time for Parse: 2 seconds
Time for Photon: 54 seconds
Time for Trace: 36 min 47 seconds
Total time: 37 min 43 seconds


Under Solaris 10 B69, Blastwave Povray 3.5 x86
Time for Parse: 7 seconds
Time for Photon: 1 min 12 seconds
Time for Trace: 53 min 14 seconds
Total time: 54 min 33 seconds

Al Hopper suggested dtrace. I knew what it was (at the time, a Solaris only feature, now also available on Mac OS/X, FreeBSD, SmartOS, OpenIndiana and other IllumOS based OSes, and now Linux with dtrace4linux), but I hadn't taken the time to use it in real world cases. So I looked into it.


Instrumentation TNG


Which one is my blood pressure??

Here is what I posted back then:
I finally had a few minutes to play around with povray and dtrace this afternoon. I followed the suggestion made by Adam Leventhal on his Blog to run:

# dtrace -n 'pid$target:::entry{ @[probefunc] = count() }' -p <process-id>
(replace <process-id> by the pid of povray)

So what I did is run povray, get its process id with ps, then run the above. Once it rendered line 1, I ctrl-c. dtrace then spit out what I needed to know. I dont have any reference to compare as to what optimisation was done exactly on the windows build. However, running the above dtrace command on that process does reveal something:

I know it is spending a lot of time in DNoise / Noise, because it's called a bazillion times. Actually almost 10million times for the pair - the only other call that is called as much is memcpy, haven't investigated yet from where, but there might be an opportunity to combine memcpy. It also points out that a fast FSB and faster memory will definitely pull in front for equal cpu.

Anyway, back to Povray, looking at texture.cpp (line 169 and following):

/*****************************************************************************/
/* Platform specific faster noise functions
support */
/* (Profiling revealed that the noise functions can take up to 50%
of */
/* all the time required when rendering and current compilers
cannot */
/* easily optimise them efficiently without some help from
programmers!) */
/*****************************************************************************/

#if USE_FASTER_NOISE

#include "fasternoise.h"
#ifndef FASTER_NOISE_INIT
#define FASTER_NOISE_INIT()
#endif
#else
#define OriNoise Noise
#define OriDNoise DNoise
#define FASTER_NOISE_INIT()
#endif


Haha! Fasternoise.h (only found in the Windows source, not the Unix source) includes

/*****************************************************************************/
/* Intel SSE2
support */
/*****************************************************************************/

#ifndef WIN_FASTERNOISE_H

#define WIN_FASTERNOISE_H

#ifdef USE_INTEL_SSE2

int SSE2ALREADYDETECTED = 0 ;
DBL OriNoise(VECTOR EPoint, TPATTERN *TPat) ;
void OriDNoise(VECTOR result, VECTOR EPoint) ;
#include "emmintrin.h"
#include "intelsse2.h"
#undef ALIGN16
#define ALIGN16 __declspec(align(16))
#endif

#endif


BTW, with DTrace it only took me a few minutes total (including running povray for 3 minutes) to identify the culprit. Under windows it would have taken me hours.

So on Solaris x86, need to add USE_INTEL_SSE2 and USE_FASTER_NOISE as compile switches and add fasternoise and the various other includes from the windows source to the unix source.
And that is how a one liner dtrace script helped in debugging my performance problem with Povray. The nice thing is that you didn't even need the source to know what exactly what was going on in the code, in real time, without step by step debugging.


Instrumenting Python


So, what is the Python connection? When running a dtrace equipped version of Python, you can use dtrace on your Python scripts. On Solaris, this has been available since 2007 (in OpenSolaris).

Unfortunately on other OSes, it hasn't been the case. Jesus Cea has been trying to get John Levon's patches integrated with CPython since before 2.7 and 3.2 came out. Not sure what is needed to make this happen, but it is long overdue. At least some distro builders should have the patched Python available, but it really needs to be incorporated into the official build.

Anyway if you look at a Solaris 11 system, it has Python 2.6 as the default, and it is ready for dtrace:

 $ dtrace -lP python*  
   ID  PROVIDER      MODULE             FUNCTION NAME  
  1044 python1905 libpython2.6.so.1.0        PyEval_EvalFrameEx function-return  
  1045 python1905 libpython2.6.so.1.0           dtrace_return function-return  
  1046 python1939 libpython2.6.so.1.0        PyEval_EvalFrameEx function-entry  
  1047 python1939 libpython2.6.so.1.0           dtrace_entry function-entry  
  1048 python1939 libpython2.6.so.1.0        PyEval_EvalFrameEx function-return  
  1049 python1939 libpython2.6.so.1.0           dtrace_return function-return  
  1050 python1945 libpython2.6.so.1.0        PyEval_EvalFrameEx function-entry  
  1083 python7640 libpython2.6.so.1.0        PyEval_EvalFrameEx function-return  
  1084 python7640 libpython2.6.so.1.0           dtrace_return function-return  
  1100 python11695 libpython2.6.so.1.0           dtrace_entry function-entry  
  1101 python11695 libpython2.6.so.1.0        PyEval_EvalFrameEx function-return  
  1102 python11695 libpython2.6.so.1.0           dtrace_return function-return  
  1103 python11699 libpython2.6.so.1.0        PyEval_EvalFrameEx function-entry  
  1214 python11693 libpython2.6.so.1.0        PyEval_EvalFrameEx function-entry  
  1215 python11693 libpython2.6.so.1.0           dtrace_entry function-entry  
  1219 python11699 libpython2.6.so.1.0           dtrace_entry function-entry  
  1220 python11699 libpython2.6.so.1.0        PyEval_EvalFrameEx function-return  
  1221 python11699 libpython2.6.so.1.0           dtrace_return function-return  
  1226 python11693 libpython2.6.so.1.0        PyEval_EvalFrameEx function-return  
  1227 python11693 libpython2.6.so.1.0           dtrace_return function-return  
  1228 python11695 libpython2.6.so.1.0        PyEval_EvalFrameEx function-entry  
  2248 python1905 libpython2.6.so.1.0        PyEval_EvalFrameEx function-entry  
  2249 python1905 libpython2.6.so.1.0           dtrace_entry function-entry  
  2250 python23832 libpython2.6.so.1.0        PyEval_EvalFrameEx function-entry  
  2251 python23832 libpython2.6.so.1.0           dtrace_entry function-entry  
  2260 python7640 libpython2.6.so.1.0        PyEval_EvalFrameEx function-entry  
  2261 python7640 libpython2.6.so.1.0           dtrace_entry function-entry  
  2315 python23832 libpython2.6.so.1.0        PyEval_EvalFrameEx function-return  
  2316 python23832 libpython2.6.so.1.0           dtrace_return function-return  
  7670 python2936 libpython2.6.so.1.0           dtrace_entry function-entry  
  7671 python2936 libpython2.6.so.1.0        PyEval_EvalFrameEx function-return  
  7672 python2936 libpython2.6.so.1.0           dtrace_return function-return  
  7750 python14523 libpython2.6.so.1.0        PyEval_EvalFrameEx function-entry  
  7751 python14523 libpython2.6.so.1.0           dtrace_entry function-entry  
  7752 python14523 libpython2.6.so.1.0        PyEval_EvalFrameEx function-return  
  7753 python14523 libpython2.6.so.1.0           dtrace_return function-return  
 12339 python1945 libpython2.6.so.1.0           dtrace_entry function-entry  
 12340 python1945 libpython2.6.so.1.0        PyEval_EvalFrameEx function-return  
 12341 python1945 libpython2.6.so.1.0           dtrace_return function-return  
 12345 python2936 libpython2.6.so.1.0        PyEval_EvalFrameEx function-entry  
 12347 python1219 libpython2.6.so.1.0        PyEval_EvalFrameEx function-entry  
 12348 python1219 libpython2.6.so.1.0           dtrace_entry function-entry  
 12349 python1219 libpython2.6.so.1.0        PyEval_EvalFrameEx function-return  
 12350 python1219 libpython2.6.so.1.0           dtrace_return function-return  


The probes are specific to Python. In the original dtrace call I had used for debugging a C++ binary (Povray), I was using the pid provider and entry probe:

 # dtrace -n 'pid$target:::entry{ @[probefunc] = count() }' -p <process-id>  


But we are no longer in 2004 and I'm not interested in the performance of Povray right now, I just want to figure out how many checksums my pingpong.py script is doing (a little module to keep a tab on my machines and their latencies), and what else is going on at the top.

So, this time I'll modify it to use the python provider instead of the pid provider and using the function-entry probe (still doing a count): 

 # dtrace -qZn 'python$target:::function-entry{ @[copyinstr ( arg1 )] = count() }' -c ./pingpong.py  
 [...]  
  register                                                         10
  abstractmethod                                                   15
  __new__                                                          17
  <genexpr>                                                        35
  <module>                                                         48
  exists                                                           49
  S_IFMT                                                           53
  S_ISDIR                                                          53
  isdir                                                            56
  makepath                                                        100
  normcase                                                        100
  abspath                                                         113
  isabs                                                           113
  join                                                            113
  normpath                                                        113
  ping_pong                                                      1000
  checksum                                                       4000
  close                                                          4000
  do_one                                                         4000
  fileno                                                         4000
  receive_one_ping                                               4000
  send_one_ping                                                  4000
  __init__                                                       4007


With 1000 ping_pong() I was expecting 3000 checksums. Ah, I see I'm sending 4000 pings, so apparently I have a for that is not properly bounded (on purpose, to illustrate an example of what even something as simple as this can tell us).

To infinity and beyond


But that is not even touching the tip of the iceberg. How about creating heatmaps (node.js and dtrace in this case)? To do something like that with Python and dtrace, a good starting point is Brian Cantrill's Thijs Metsch's python-dtrace on Pypi (sorry for the wrong attribution, Brian's name was at the top of the page on Pypi).

You should also check out the following tutorial http://dtracehol.com/#Exercise_11 that was part of a tutorial session on dtrace at Java One last year (yep, Python at Java One).

François
@f_dion

Friday, September 14, 2012

Sidekick 2

Continuing on using the raspberry pi as your desktop's sidekick, we will focus today on making it easier to work with, better integrated, when your desktop is Unix (Solaris, OpenIndiana), Linux, Mac OS/X or even Windows (except you wont be able to use ssh-keygen or scp - instead check the section I Got a PC? toward the end of the post).

Automating login

First thing first, we need to create a new user on the Raspberry Pi. Although the user pi is pretty cool, you dont want to have to specify the user in all the commands you will do, so we'll match it to the username on the desktop.

Let's say your username is user on your desktop (of course, if you want to have a username billybob, then replace user with billybob in the below code). You will need to connect as the pi user, then set up a new user:


 ssh pi@raspberrypi  
 (enter your pi user password)  
 pi@raspberrypi ~ $ sudo useradd -d /home/user -s /bin/bash user   
 pi@raspberrypi ~ $ sudo mkdir /home/user  
 pi@raspberrypi ~ $ sudo chown user:pi /home/user  
 pi@raspberrypi ~ $ sudo passwd user  
 pi@raspberrypi ~ $ Enter new UNIX password:  (type password)
 pi@raspberrypi ~ $ Retype new UNIX password:  (type it again)
 pi@raspberrypi ~ $ passwd: password updated successfully  
 pi@raspberrypi ~ $ sudo cp .bashrc ../user
 pi@raspberrypi ~ $ sudo cp .profile ../user

The last item we have to do is to edit the /etc/sudoers file and add our user to it ([esc] means hit the escape key):

 pi@raspberrypi ~ $ sudo vi /etc/sudoers  
 (add the following line after going to last line and typing o)  
 user ALL=(ALL) NOPASSWD: ALL  
 [esc] :wq!
 pi@raspberrypi ~ $ exit

BTW, for most people, there is too much detail (such as how to add a line in vi), but keeping in mind that there are some people in schools reading this and they just starting playing with this, I think it is well justified).

 We now go back to our desktop and test that we can login as the user (no need to specify user@raspberrypi, just raspberrypi since the default is to user the desktop current user):

 user@desktop ~ $ ssh raspberrypi  
 (enter password)  
 user@raspberrypi ~ $ mkdir .ssh  
 user@raspberrypi ~ $ exit  

Now, we will generate an RSA private and public key pair. We will then copy the public key to the RPi as authorized_keys2 under the .ssh folder:

 user@desktop ~ $ ssh-keygen -t rsa  
 (enter to accept the defaults)  
 user@desktop ~ $ cd .ssh  
 user@desktop ~ $ scp id_rsa.pub raspberrypi:.ssh/authorized_keys2  
 (enter password)  

We will login once more on the RPi to change access:

 user@desktop ~ $ ssh raspberrypi  
 (enter password)  
 user@raspberrypi ~ $ cd .ssh  
 user@raspberrypi ~ $ chmod go-r authorized_keys2  
 user@raspberrypi ~ $ exit  

At last, we can now copy files using scp or login on our RPi without entering a password:

 user@desktop ~ $ ssh raspberrypi  
 user@raspberrypi ~ $  

Yeah!

SCP tasks

Getting a file

To get a file from the RPi, onto the desktop:

The file is in the /home/user directory:
user@desktop ~ $ scp raspberry:file.txt .
 
The file is in /home/user/directory:
user@desktop ~ $ scp raspberry:directory/file.txt .
 
The file is in /home/user/directory/subdirectory:
user@desktop ~ $ scp raspberry:/home/user/directory/subdirectory/file .

Putting a file

To get a file from the RPi, onto the desktop:

The file is in the /home/user directory:
user@desktop ~ $ scp raspberry:file.txt .
 
The file is in /home/user/directory:
user@desktop ~ $ scp raspberry:directory/file.txt .
 
The file is in /home/user/directory/subdirectory:
user@desktop ~ $ scp raspberry:/home/user/directory/subdirectory/file .

Action on a directory

To get or put a directory, simply use the -r flag:

user@desktop ~ $ scp -r mydir raspberry:
 
This will copy recursively mydir onto the server named raspberry, into the default home directory. There is a lot more flexibility to scp, so read up on it:

user@desktop ~ $ man scp

GUI access

I use OpenIndiana as a desktop, most of the time, and that OS, and most Linux versions, has a tool to connect to a server using various protocols and provide a GUI. In the case of OpenIndiana, it is the gnome tool that can be found in the menu as item "connect to server":


This will then open a Nautilus file browser:

Other Options

Another option under unix/linux to access files remotely is through sshfs, a FUSE module. It allows to mount an ssh (sftp) remote system as a local filesystem. If you need this, you are probably already know how to use it, so I wont get into details.

I got a mac?

There is no GUI option directly, Basically, using the technique above with FUSE, I've done it on my Mac using FUSE at http://osxfuse.github.com/, then I downloaded Macfusion.


If anybody wants a more detailed instruction, leave a comment. I dont want to spend too much time on this if no reader is using a raspberry pi as a sidekick to a Mac.

I got a PC?

To automatically login without password, you will need putty (see the previous blog entry on this) and also puttygen. But at the end of the day, why bother? 

The OS doesn't leverage this. Instead, get a GUI interface like Winscp to copy files back and forth.


I use winscp all the time with Windows 7, and you can save configurations, including passwords, so this is fairly painless.